Get started with PriceLabs now!
Want to learn what PriceLabs can do for you? See for yourself with a free trial. Get started now!

Most guides to short-term rental analytics stop at the formulas. You learn what RevPAR is, you learn how to calculate occupancy, and then you close the tab holding a vocabulary list instead of a decision.
This guide takes one property and carries it all the way through. Same cabin, same comp set, same numbers, from the first metric to the final call.
It also answers the question almost nobody in this category answers honestly. Every market occupancy figure you have ever seen was inferred from listing calendars rather than read from booking records, which means a night the owner reserved for their own family looks identical to a night a guest paid for. Correcting that is the single largest adjustment in the pipeline, and the accuracy section below sets out what survives it.
Short-term rental analytics is the practice of measuring how a listing performs, comparing that performance against a defined set of competing properties, and changing pricing or availability based on the gap between the two. It draws on two data streams: your own booking history, and market-level data about what comparable listings are charging and filling.
The second stream is the one that makes it analytics rather than bookkeeping. Your own numbers tell you what happened. Only market data tells you whether what happened was good.
If you already know what you want to look at, skip the guide. Readers who have done this before and just need the numbers should go straight to PriceLabs Market Dashboards, pick a market, and build a comp set. Readers who want a revenue projection for a property they are thinking of buying want Revenue Estimator Pro instead, because that is an underwriting question rather than an analytics one. Everyone else, keep reading.
Every number below belongs to one listing.
The Lakeside Cabin. Two bedrooms, sleeps six, hot tub, twenty minutes from a mid-sized lake town. Listed on Airbnb and Vrbo. It has been live for two full years, so there is enough history to read.
The figures are illustrative rather than drawn from a real account. The arithmetic is real, which is the part that matters, because the method works identically whichever numbers you substitute. Open your own payout report alongside this section and run the same steps.
Here is the cabin's last twelve months:
| Input | Value |
|---|---|
| Calendar nights | 365 |
| Owner-blocked nights | 30 |
| Sellable nights | 335 |
| Booked nights | 201 |
| Separate stays | 67 |
| Nightly room revenue | $46,230 |
| Cleaning fees collected | $6,365 |
Nothing in that table is a metric yet. It is raw material.
Seven or eight metrics get named in most guides. Six of them do actual work.
Booked nights divided by sellable nights, times 100.
The cabin: 201 ÷ 335 = 60.0%
The trap is the denominator. If you divide by 365 instead of 335, the cabin reads 55.1%, and you spend a season trying to fix a problem you invented by counting your own vacation as a failed booking. Owner blocks, maintenance holds and renovation weeks come out before you calculate anything.
Room revenue divided by booked nights. Cleaning fees stay out, because a cleaning fee is a cost recovery rather than a rate.
The cabin: $46,230 ÷ 201 = $230.00
Revenue per available night, which is ADR multiplied by occupancy.
The cabin: $230.00 × 0.60 = $138.00
Cross-check it the other way: $46,230 ÷ 335 = $138.00. Both routes agree, which is a useful habit whenever you build a report, since a mismatch means your night counts are wrong somewhere.
RevPAR is the number to benchmark on, because it is the only one that cannot be gamed by trading one lever against the other. A listing can lift ADR by pricing itself out of the calendar, and it can lift occupancy by discounting into the floor. RevPAR catches both.
Booked nights divided by the number of separate stays.
The cabin: 201 ÷ 67 = 3.0 nights
ALOS is the metric most guides list and then abandon. It earns its place because it explains cost. Sixty-seven stays means sixty-seven turnovers, sixty-seven linen changes and sixty-seven chances for a bad check-in. A listing with the same revenue at 4.5 nights per stay runs roughly forty-five turnovers instead, which is twenty-two fewer cleans across the year. ALOS also sets the ceiling on what your minimum-stay rules can do without costing you bookings.
The median gap in days between a reservation being made and the guest arriving.
The cabin: 22 days
There is a fuller treatment of measuring booking lead time if the term is new. Lead time is a diagnostic instrument rather than a target. A calendar that fills late is telling you that early-window travellers are looking at your rate and choosing something else, since the guests who book ninety days out are the least price-pressured guests in the market.
What survives after everything comes out.
Gross booking value for the cabin is $46,230 plus $6,365, which is $52,595. Net revenue is that figure minus platform host fees, cleaning costs actually paid to cleaners, supplies, utilities, software, insurance, taxes and management. The gap between the two is where most first-year hosts lose their bearings, because a strong-looking $52,595 can sit on top of a much thinner reality.
Platform fee treatment varies by channel, by plan and by whether the host or the guest carries the charge, so pull yours from your own payout statements rather than from a benchmark table. If you want the full expense stack laid out properly, the Airbnb income calculation guide carries it line by line.
Review score sits outside this six, though it is worth tracking quarterly, since platform ranking responds to it and recovering lost visibility takes longer than protecting it. The Airbnb listing optimization guide covers what actually moves that number.
Six numbers describe the cabin. On their own they mean nothing, because $138 RevPAR is excellent in one market and poor in another. Comparison is what turns a measurement into a finding.
The weak version of this is drawing a circle on a map and averaging whatever falls inside it. That gives you an answer, and the answer will be wrong in ways you cannot see, because it mixes studios with five-bedroom lakehouses, includes listings that went live last month with no rating, and counts properties that are about to be shut down by a permit cap.
Four filters separate a comp set you can defend from one you cannot:
For the cabin, that produced a comp set of 24 listings: two-bedroom, hot tub, within four miles of the same lake access point, rated 4.7 or higher, active for at least twelve months. Twenty-four is a workable size. Anything under about ten and one unusual property distorts the median; anything over a hundred and you have stopped comparing and started averaging.
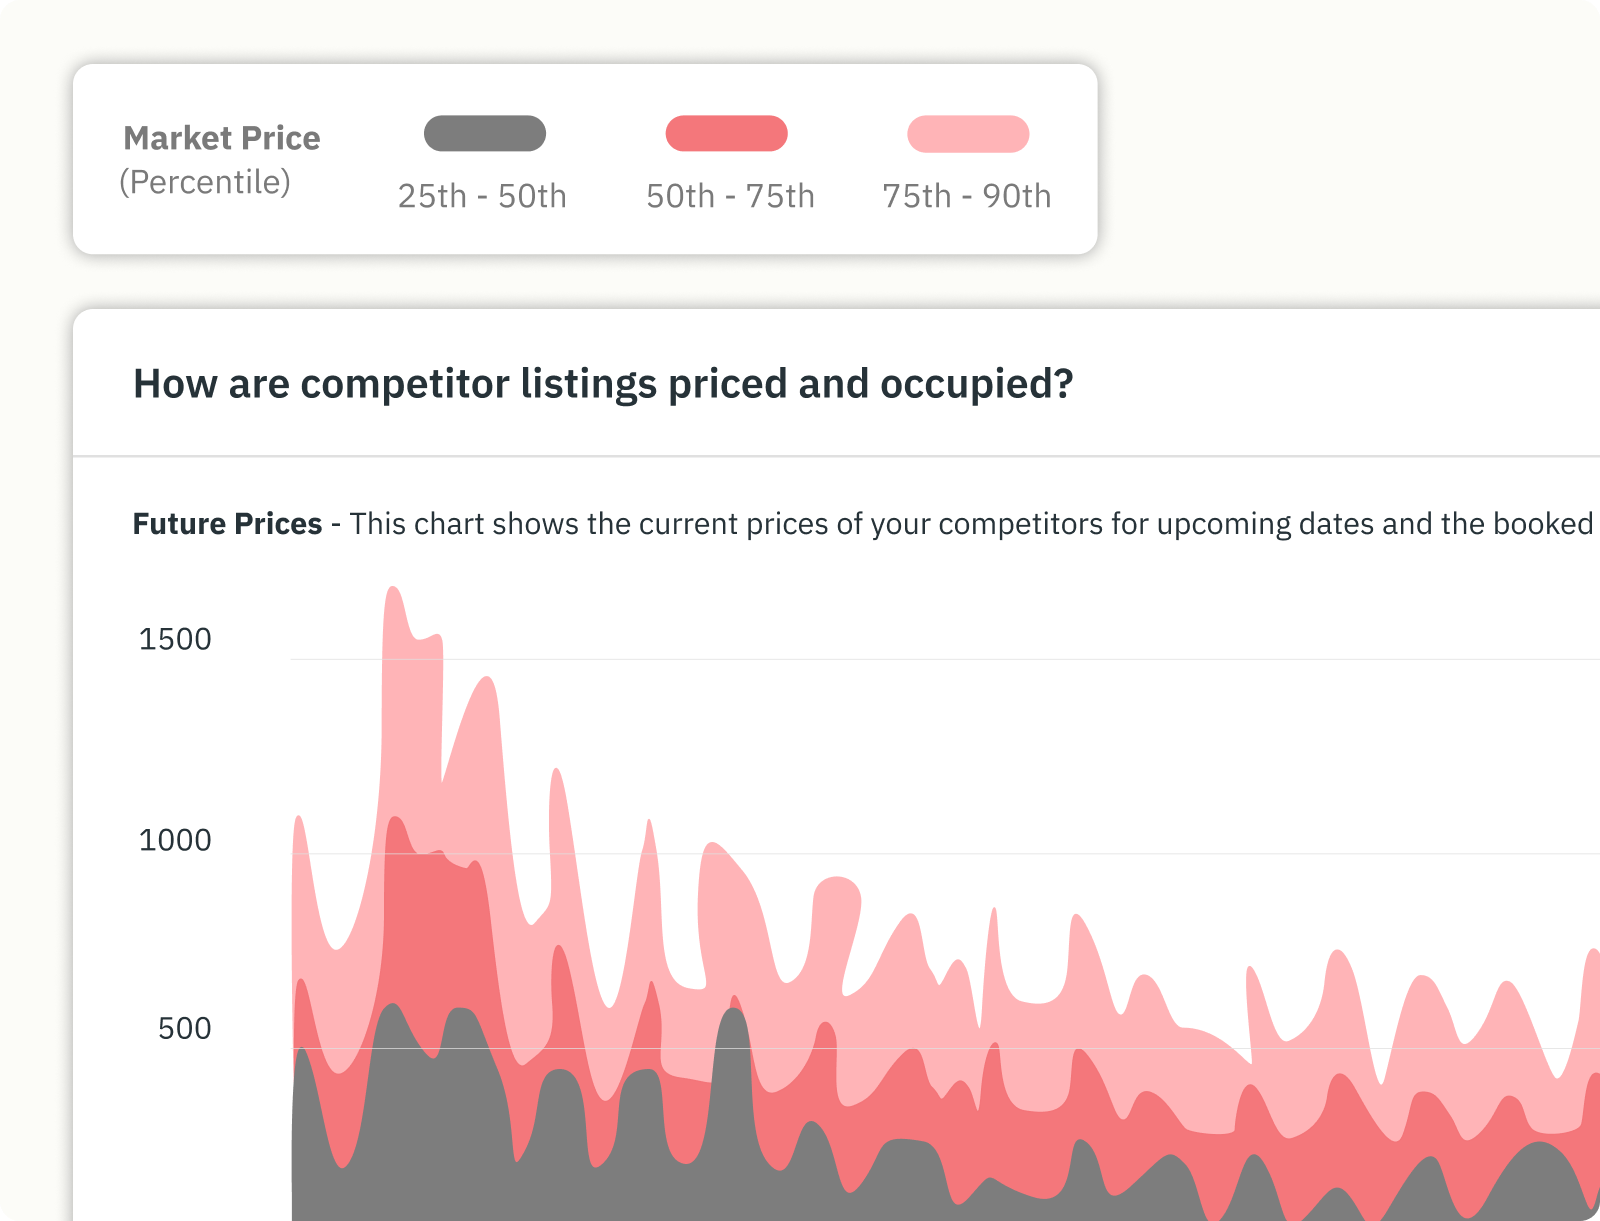
PriceLabs builds these as Comp Sets inside a Market Dashboard, with more than forty filters available, and up to thirty separate Comp Sets inside a single dashboard so you can hold your lake-access set and your town-centre set side by side. There is a fuller treatment of defining your competitive set, and a hyperlocal version in the guide to drilling to neighborhood level.
Comp-set construction is where most short-term rental analytics work either earns its keep or quietly fails, because every finding downstream inherits whatever bias you built into the set.
Here is the cabin against its 24 comps.
| Metric | Lakeside Cabin | Comp set median | Gap |
|---|---|---|---|
| RevPAR | $138.00 | $161.00 | -$23.00 |
| ADR | $230.00 | $224.00 | +$6.00 |
| Occupancy | 60.0% | 72.0% | -12.0 pts |
| ALOS | 3.0 nights | 3.8 nights | -0.8 |
| Booking window | 22 days | 47 days | -25 days |
Check the comp median for internal consistency before trusting it: $224.00 × 0.72 = $161.28, which rounds to the $161 RevPAR shown. The set holds together.
Now read it.
The cabin's rate is not the problem. At $230 it sits $6 above the comp median, which is close enough to be noise. The occupancy line is where the twelve-point hole is, and the booking-window line explains it. The cabin fills 25 days later than its comps, meaning it is losing the early-window traveller and then catching up on late demand. That is the signature of a listing priced correctly for peak weeks and priced too high for everything else.
The annual cost: $23.00 of RevPAR across 335 sellable nights is $7,705 of room revenue the comp set says is available.
What closing it looks like arithmetically. Hold ADR at $230 and move occupancy from 60% to 68%, which is four points short of the comp median rather than level with it. That is 228 booked nights instead of 201. Room revenue becomes 228 × $230 = $52,440, an increase of $6,210.
Two honest caveats before anyone puts that in a forecast.
First, a comp set proves a gap exists without proving the gap is winnable. The cabin may be twenty minutes further from the water than most of its comps, and no pricing change fixes a location. The comp set tells you where to look, and the property tells you what is actually possible.
Second, occupancy and ADR trade against each other. Filling 27 additional nights will almost certainly involve accepting lower rates on some of them, so the true outcome sits below $6,210. Model it at the rate you would actually accept rather than at the peak rate, and then check whether 27 more turnovers are worth the cleaning cost, which at $95 a clean and roughly nine additional stays is around $855 of extra spend.
Run your own numbers. The calculator below takes the same seven inputs, returns the same six metrics, and computes your gap and its annual value. Working through projecting forward revenue covers what to do once you have the figure.
The changes that follow from this diagnosis are lowering the shoulder-season rate floor, opening the booking window with earlier availability, and cutting minimum stay on orphan gap nights so the two-night holes between reservations become bookable. All three are pricing decisions rather than analytics ones, which is where the dynamic pricing guide picks up, and where the revenue management guide covers how the calendar strategy fits together across a season.
This is the section most analytics guides skip, and skipping it is why sophisticated readers distrust the whole category.
Airbnb market data, and STR market data generally, is an estimate rather than a record. No commercial provider has access to booking records. Airbnb and Vrbo do not sell them. What providers have is availability: they read listing calendars at intervals, watch nights flip from open to unavailable, and infer bookings from the pattern. PriceLabs collects publicly available Airbnb and Vrbo listing data and refreshes it daily.
Inference introduces four specific problems, and how a provider handles them determines whether the numbers are usable.
A night the owner reserved for their own family reads exactly like a night a guest paid for. Without correction, every market's occupancy is overstated and every host benchmarks against a fiction. PriceLabs applies block-removal logic to separate real bookings from owner blocks, which is the single largest source of error in scraped occupancy data.
A listing that appears on both Airbnb and Vrbo goes unavailable on both when it books once. Cross-OTA deduction reconciles the duplicate so the market's booked-night count does not inflate.
When a guest books through a host's own website, no OTA transaction exists. The night still closes on the OTA calendar, so it can be captured as occupied through availability tracking, though the rate that was actually charged is unknown. Any ADR figure for a market with heavy direct-booking volume is therefore reading an incomplete sample.
Calendar prices are asking prices. Discounts, negotiated rates and promotional adjustments settle below the displayed figure, so ADR estimates skew slightly high in soft markets where discounting is common.
The practical rule that comes out of this: estimate reliability scales with comp-set size and market density. Twenty-four comps in an established lake market produce a median you can act on. Six comps in a rural market where three of them are the same operator produce a number that will move twenty percent when one listing changes its calendar. In thin markets, treat the direction of travel as the finding and treat the absolute figure as an approximation.
Distrust an estimate when the comp set is under about ten listings, when a market has recently had a regulatory change that removed supply, when a large share of local inventory is professionally managed with direct booking channels, or when a single event weekend is doing most of the annual revenue.
None of this makes market data unusable. It makes it a directional instrument rather than an accounting record, which is the correct way to hold it. A comp set that says you are twelve points under is worth acting on. A comp set that says you are one point under is worth ignoring.
Airbnb's host dashboard and Vrbo's tools report your own listing accurately and completely. They will show you views, conversion, bookings and earnings, and for a first-year host that is a reasonable place to start.
What they cannot show you is the comp set, because a platform will not tell you how the property down the road is performing. They also stop at their own marketplace, so a host on both channels sees two partial pictures and never a combined one. Neither reports forward pace against a historical baseline, which means a soft November arrives as a surprise rather than as a signal you caught in September.
The cabin's twelve-point occupancy gap does not appear anywhere in Airbnb's dashboard. Sixty percent occupancy looks perfectly reasonable in isolation. It only becomes a finding next to 72%.
Tools in this category split by what they are built to answer. Market intelligence products answer "how is my market behaving." Underwriting products answer "what would this property earn if I bought it." Portfolio products answer "which of my listings is slipping." Buying the wrong category is the most common and most expensive mistake in the tool decision.
| Specification | What to ask | PriceLabs Market Dashboards | PriceLabs Revenue Estimator Pro | Airbnb / Vrbo native |
|---|---|---|---|---|
| Built for | Which of the three questions does it answer | Market intelligence, benchmarking | Pre-purchase underwriting | Own-listing reporting |
| Data source | Whose calendars, and how are owner blocks handled | Public Airbnb and Vrbo listing data, block removal applied | Public Airbnb listing data | First-party booking records |
| Refresh Daily, weekly, or monthly, since a stale comp set is a wrong comp set Daily Confirm with vendor Live | Refresh | Daily, weekly, or monthly, since a stale comp set is a wrong comp set | Daily | Confirm with vendor Live |
| Granularity | Can it go below city level, and how many filters | Custom radius 0.1 to 50 km; 1k, 5k or 10k listings; 40+ filters; up to 30 Comp Sets | Up to 350 listings within 15 km | Single listing |
| History and forward view | Does it show what is coming, or only what happened | 2 years back, 1 year forward | 1 year back | Varies |
| Entry price | What does the smallest useful configuration cost | From $9.99 per dashboard per month | From $2.50 per estimate | Free |
Competitor products are deliberately absent from this table. Populating six specification columns for AirDNA, Mashvisor, Rabbu and Key Data means twenty-one cells of vendor pricing and coverage, and publishing any of it from memory would be guessing in public. The column of questions is the portable part, so take it to whichever vendor you are evaluating and make them answer it. There is a category-level view in the Airbnb analyzer comparison and in the guide to analytics tools for hosts.
The question worth asking is not which tool has the most data, since coverage is broadly similar across the paid options. It is whether the tool ends at a number or ends at an action. A dashboard that tells you occupancy is twelve points light has done half the job, whereas one whose comp sets flow directly into your pricing engine has done all of it.
Analytics for an existing listing asks whether you are performing. Analytics for a market you are considering asks whether performance is possible.
Five things to establish, in order:
Stop there. Turning those five into a purchase decision means modelling net operating income, cap rate and cash-on-cash return, which is a different exercise with different inputs, and Revenue Estimator Pro is linked at the top of this guide for exactly that. The full method for reading a market's trends covers the screening pass end to end.
Analytics fails on consistency rather than on complexity. A simple review run every month beats a sophisticated one run twice a year.
One change at a time is the part people skip. Adjusting the rate floor, the minimum stay and the cancellation policy in the same week means the following month tells you nothing about which of them worked. There is a practical walkthrough of putting numbers to work once the routine is running. The property management guide covers how this cadence scales across thirty owners, and the vacation rental automation guide covers what can be handed to software.
RevPAR, because it folds pricing and occupancy into one figure and cannot be flattered by trading one against the other. Once RevPAR is stable, ADR and occupancy become useful for diagnosing why it moved. There is a plain-language reference for these terms in the vacation rental glossary.
It depends entirely on the market, which is why the number needs a comp set beside it. The Lakeside Cabin's 60% sits twelve points under its comps and reads as underperformance, whereas the same 60% in a heavily seasonal ski market could be a strong year. Benchmark locally or the figure means nothing.
It is inferred from listing availability rather than read from booking records, so treat it as directional. Accuracy improves with comp-set size and market density, and degrades in thin markets, in markets with heavy direct-booking volume, and immediately after a regulatory change removes supply. The reliability section above sets out when to distrust an estimate.
A single-property host has the most to gain proportionally, since every booking decision moves a larger share of total revenue. Platform-native analytics will orient you, though they cannot show you a comp set, which is the part that turns your own numbers into a finding. Hosts weighing this up often start with hyperlocal benchmarking for hosts before subscribing to anything.
ADR is revenue per booked night. RevPAR is revenue per sellable night, booked or empty. The cabin's ADR of $230 describes its pricing, whereas its RevPAR of $138 describes its whole business, because the 134 empty nights are in the second figure and absent from the first.
Permit caps and licensing requirements remove listings, which tightens supply and can improve conditions for operators who remain compliant. The complication is that historical data from a pre-regulation market includes listings that no longer exist, so a market's own past performance can overstate what is currently achievable. Check the regulatory position before trusting any trailing twelve-month figure.
Pull your last twelve months, calculate the six metrics on the cabin's model, build a comp set of at least ten genuinely similar listings, and find your RevPAR gap. That single number tells you whether you have a pricing problem, an occupancy problem or neither. The guide to becoming an Airbnb host covers the setup steps that come before any of this.
Want to learn what PriceLabs can do for you? See for yourself with a free trial. Get started now!