Stop Guessing What Your Market Is Doing
Market intelligence and competitive benchmarking for short-term and mid-term rental operators.
No credit card. Plans start at $9.99/month.
From Market View to Decision in Minutes
Trusted by Operators and Hosts Who Need to Be Right

We use Market Dashboards, and it has a tool where it will show us the list of top-performing properties in the specific area code or specific resort that we want to compare.

There’s this misconception that you need to be good at math to understand data, but Market Dashboards made it intuitive and accessible.

PriceLabs’ Market Dashboards was what really made me fall in love! It was specific enough information to help me make decisions.
Know Exactly What’s Happening in Your Market
Build custom Comp Sets with 40+ filters — location, bedrooms, amenities, ratings — ensuring accurate benchmarking
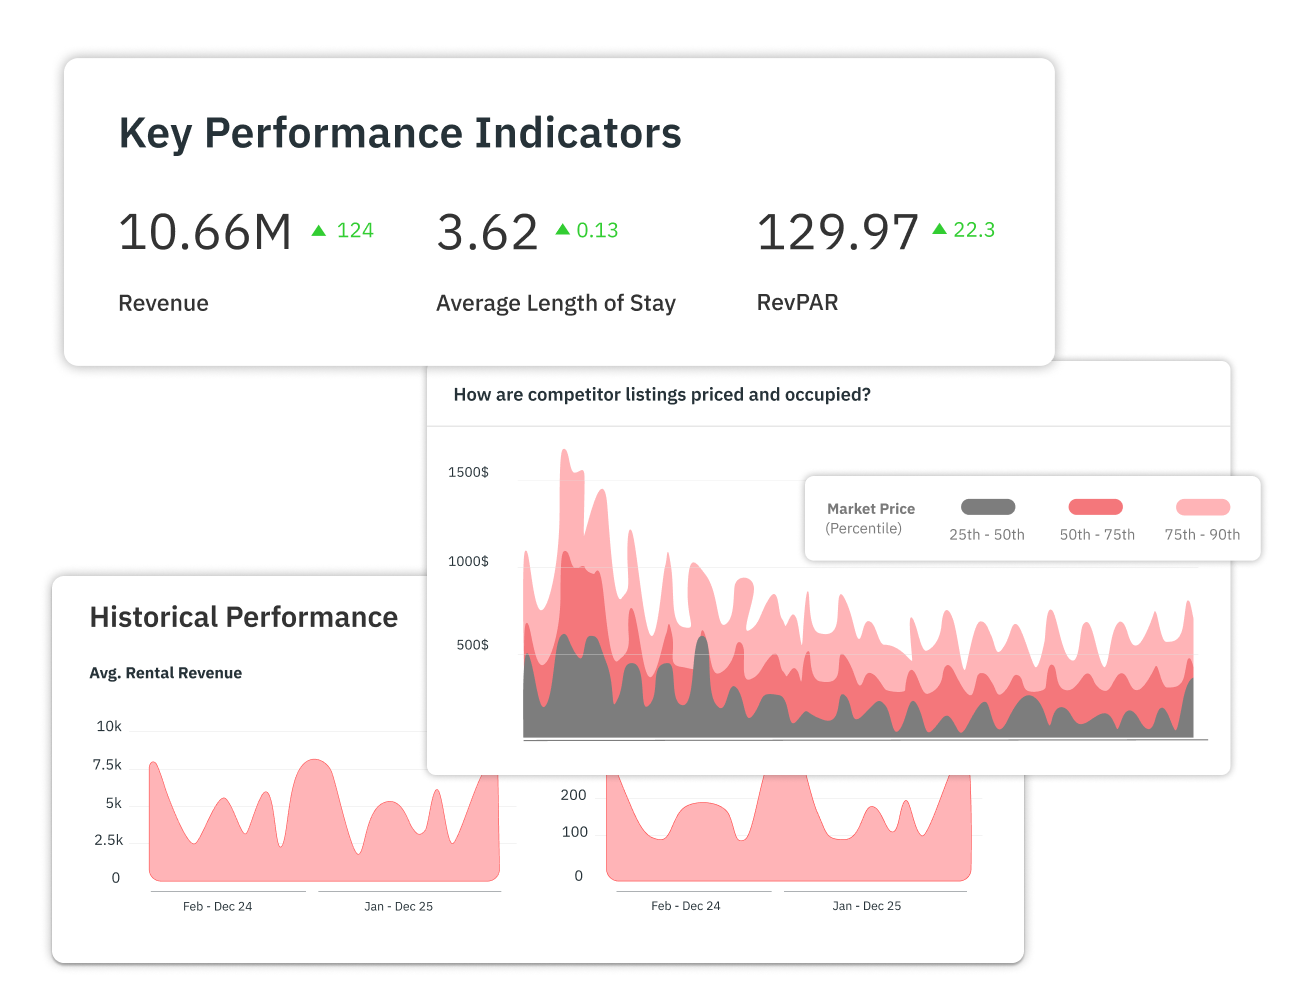
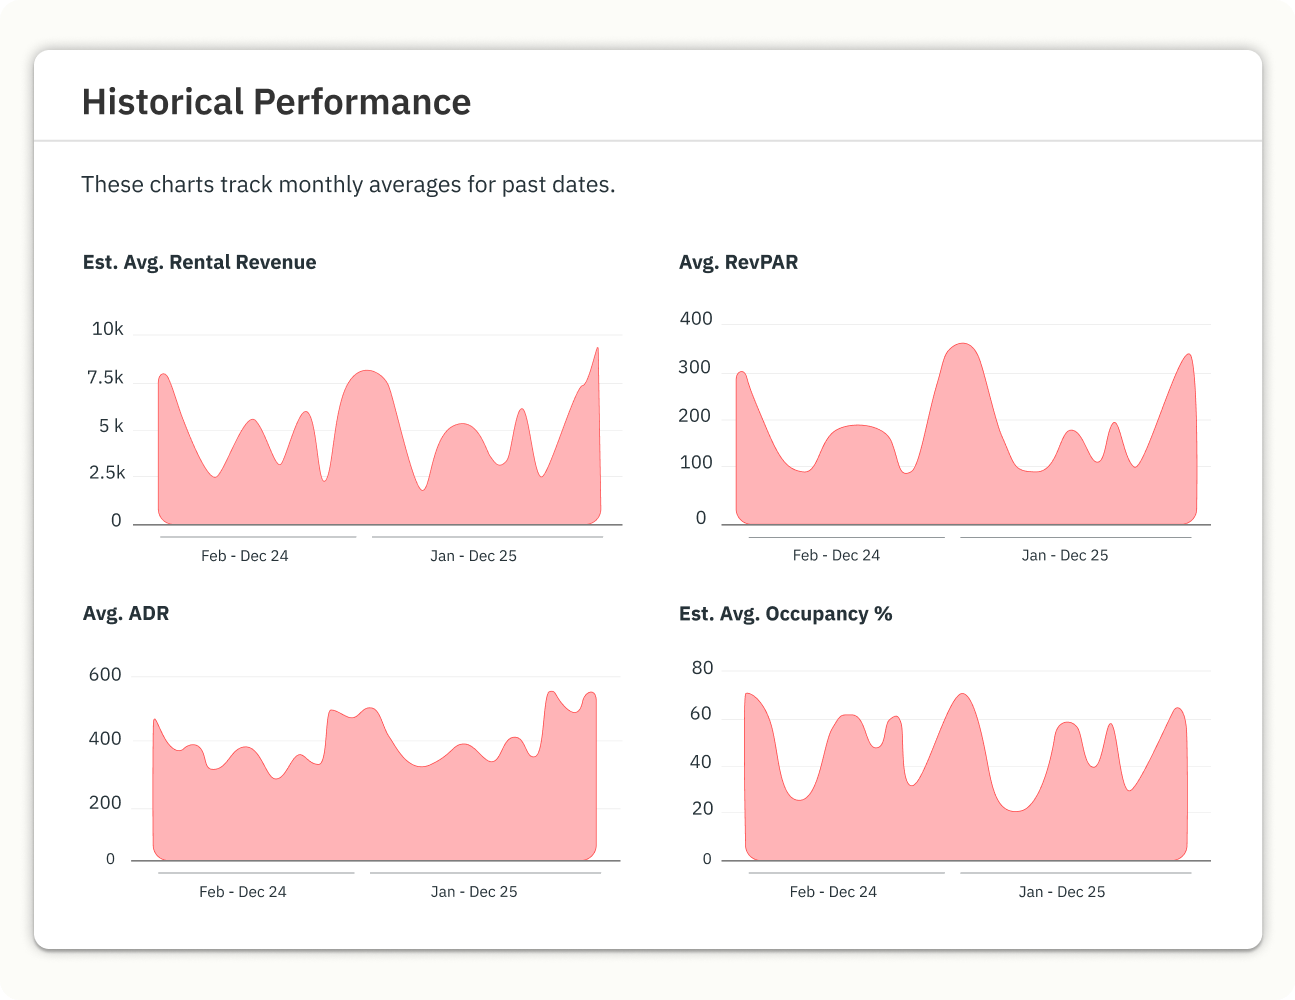
RevPAR, occupancy, and ADR side by side with your comp set make it obvious which properties are ahead and which are falling behind
See Demand Before It Arrives
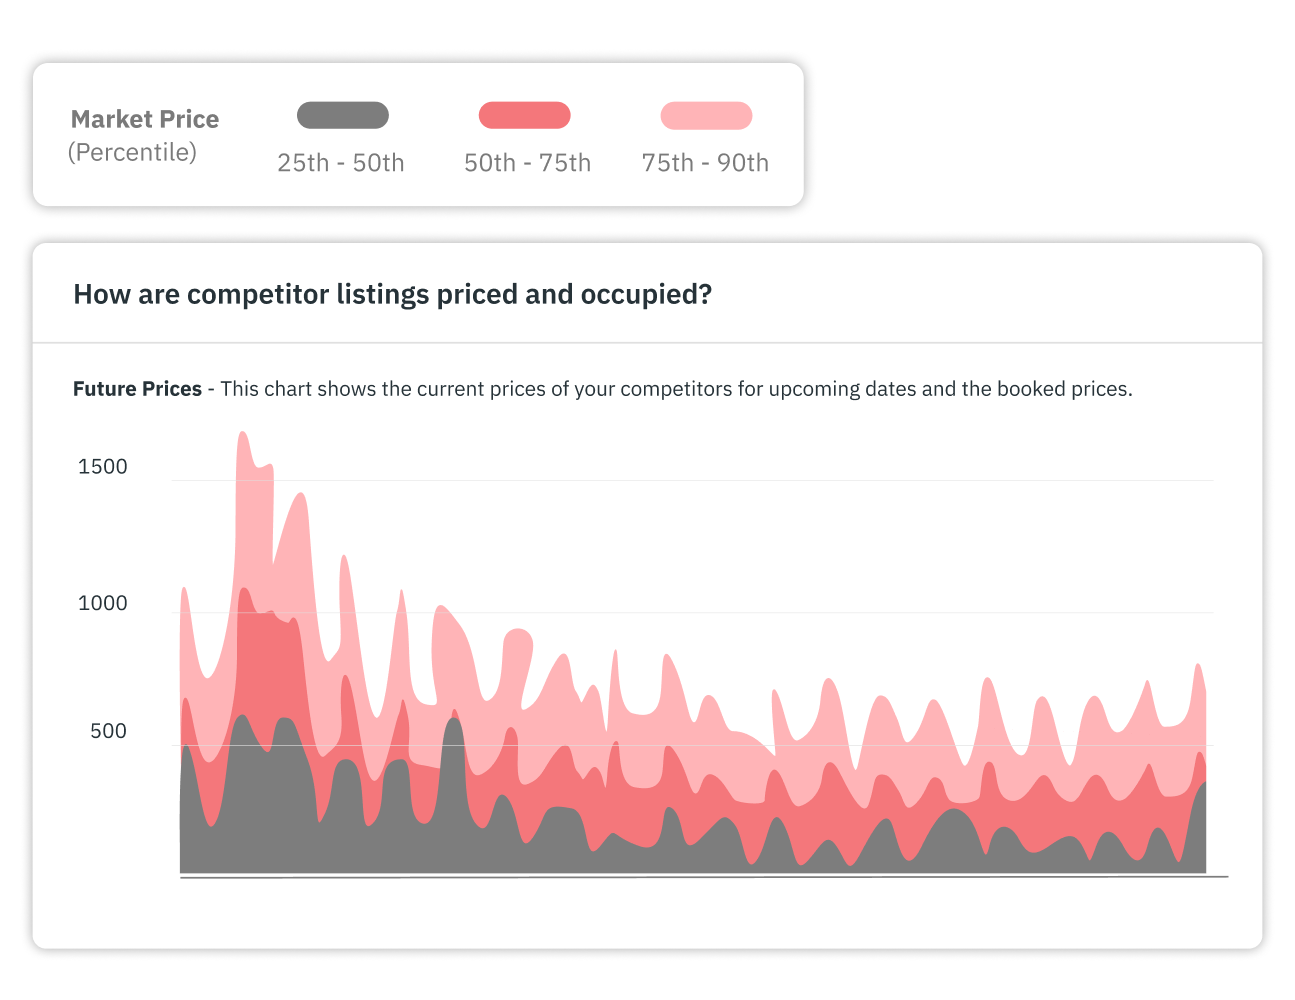
Booking curves, lead time, and pacing show you whether the market is filling or softening for the months ahead
Length-of-stay patterns, booking windows, and future occupancy across the market, not just last year’s numbers
Show Owners the Story, Not a Spreadsheet
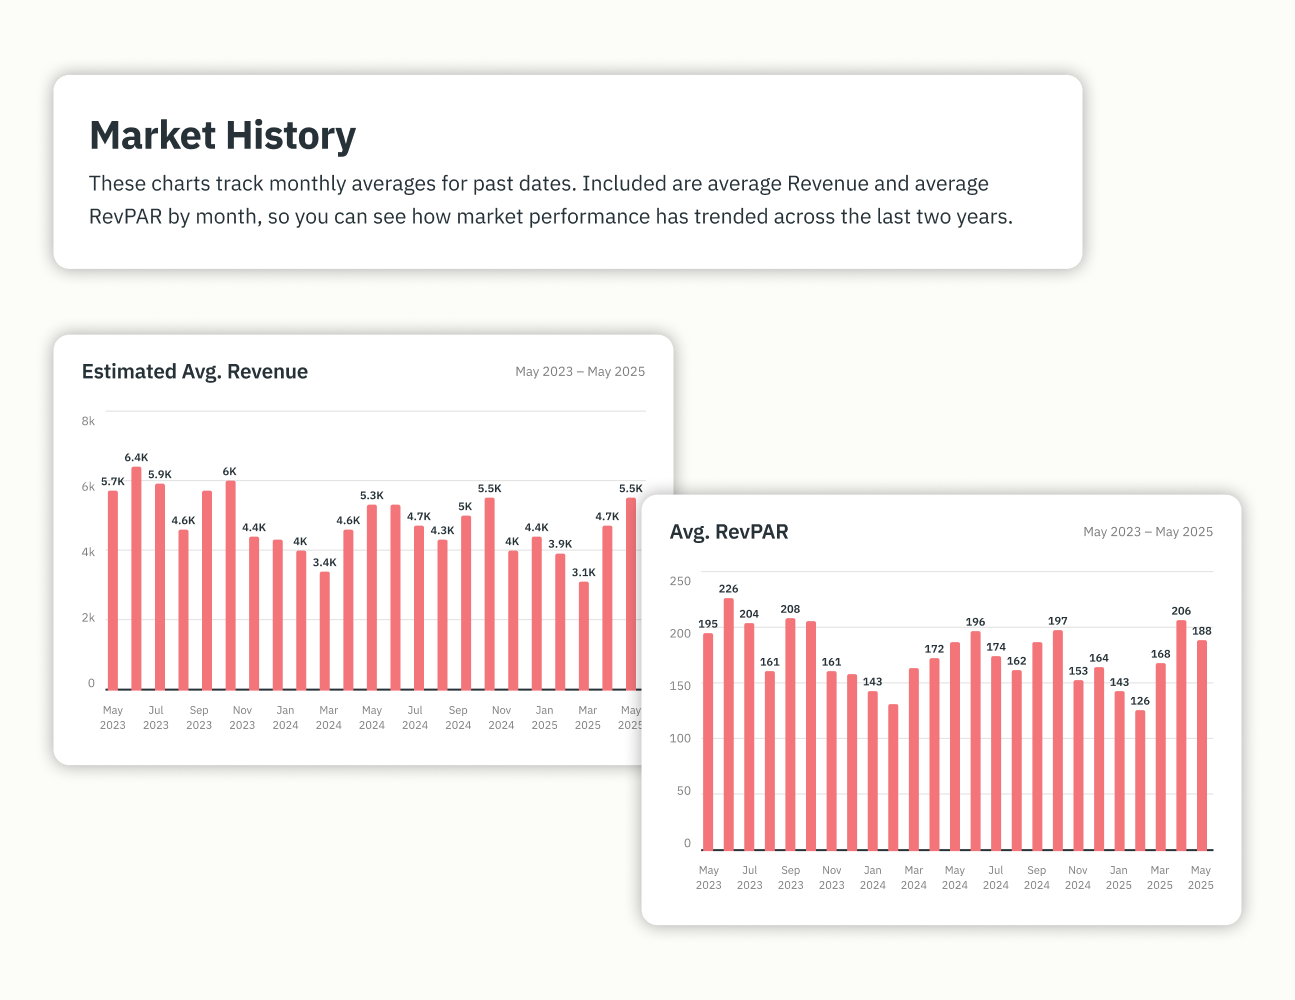
Branded PDF reports with your logo and colors — the kind you can put in front of an owner or your team without reformatting a thing
Weekly summary emails land on their own, so owners and teammates always know what changed and why — without you pulling the numbers
Built to Work With Your Pricing
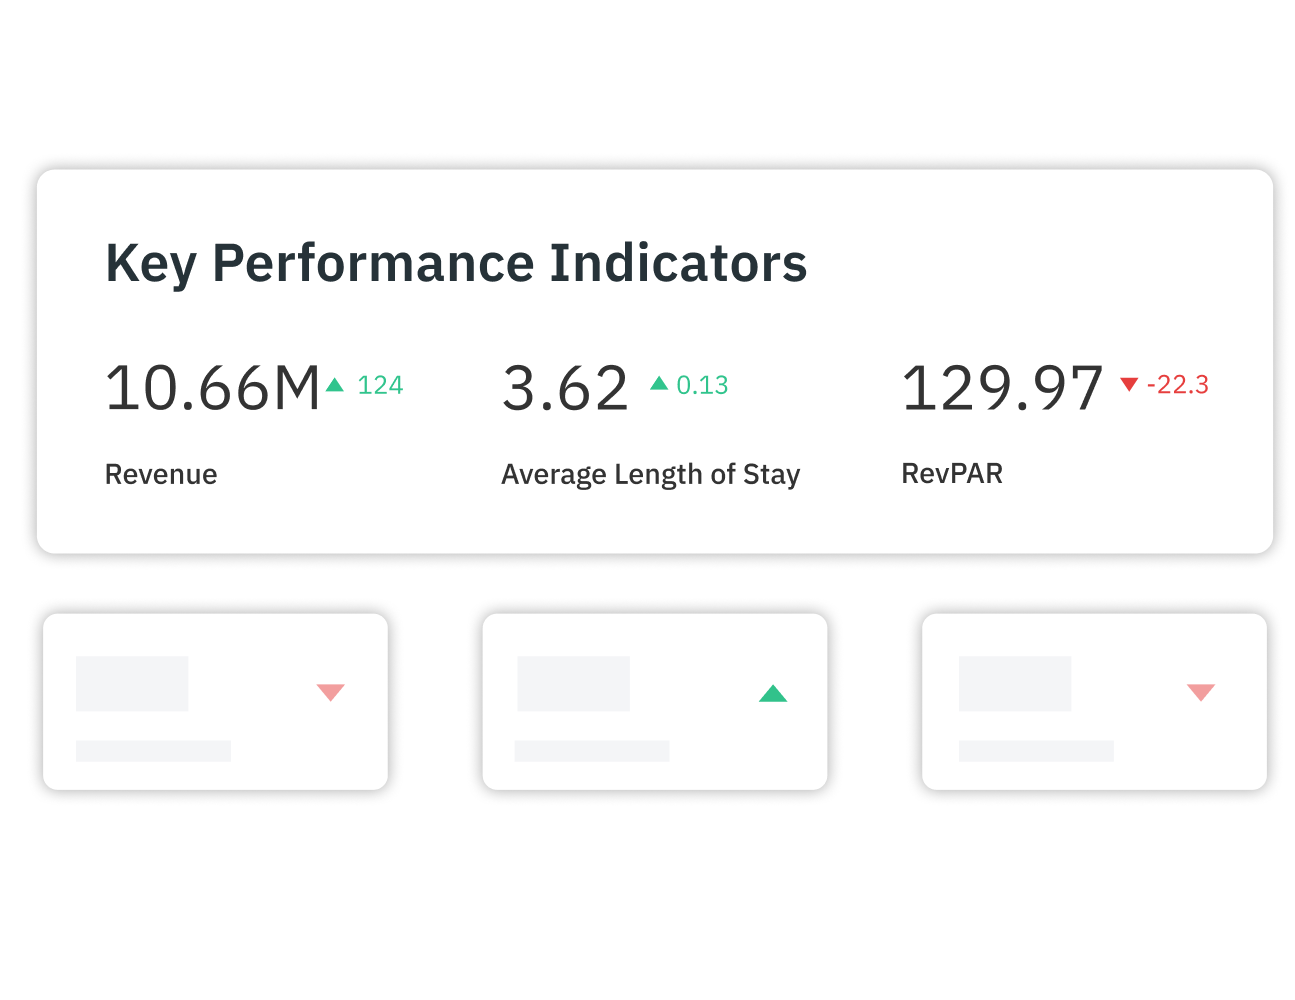
When you price with PriceLabs, the Comp Sets you build here flow straight into Dynamic Pricing and Portfolio Analytics — no rebuilding
The same competitive set drives your market view, your pricing, and your pacing reports, so everything lines up
Make Confident Decisions With Market Dashboards
Pick a ready-to-view market or build your own, and get the full picture in minutes.

How Market Dashboards Works
Search a ready-to-view market or draw a custom area on the map
Start with a guided view — research, benchmarking, or demand — or open the full dashboard
Create up to 30 custom Comp Sets to compare listings, neighborhoods, or segments
Track trends over time, export reports, or schedule email updates
Everything You Need To Better Analyze Your Market
Understand your market like the teams who consistently come out ahead.