
Get started with PriceLabs now!
Want to learn what PriceLabs can do for you? See for yourself with a free trial. Get started now!
Every Airbnb host hits the same wall eventually. Your calendar has empty nights, a competitor two streets over just raised their nightly rate, and you cannot tell if your own pricing is too high, too low, or right where it needs to be. An Airbnb analyzer exists to solve exactly that problem. It pulls market data, competitor pricing, and your own listing history into one place so you can price with evidence instead of a hunch.
This guide covers what an Airbnb analyzer actually does, the specific things that separate a strong analyzer from a basic one, and how the leading tools on the market, including PriceLabs, compare on the features that matter most to independent hosts.
An Airbnb analyzer is a tool that studies your listing's pricing, occupancy, and local market data, then tells you whether your rates are competitive and where your calendar has room to improve. The strongest analyzers combine live competitor benchmarking, historical performance tracking, and forward-looking pricing recommendations in a single dashboard, rather than leaving hosts to piece the picture together across spreadsheets and manual research.
An Airbnb analyzer helps hosts understand how a rental is performing and how to price it more accurately, using real market data instead of guesswork. It doesn't replace your judgment. It gives you the numbers behind it.
In practice, an Airbnb analyzer answers questions like:
Most analyzers pull from a mix of sources: your own booking history, competitor listings in your area, and broader market trends like seasonality and local events. The output ranges from a simple average daily rate (ADR) recommendation to a full dashboard tracking occupancy, pacing, and revenue side by side. If you're new to these terms, the vacation rental glossary is a good place to look up ADR and other metrics as they come up.
For hosts running a handful of listings, the real value isn't the raw data. It's what the data saves you from doing manually: checking competitor calendars by hand, second-guessing every price change, and reacting to demand shifts after they've already cost you bookings.
Not every analyzer solves the same problem, so it helps to know what to check before you commit to one.
The next section breaks down how PriceLabs measures up against three of the most commonly searched Airbnb analyzer tools on exactly these points.
If you've ever sat there at night wondering whether your prices are too high, too low, or just plain wrong, you're not alone. Most hosts start out doing everything manually: watching competitor listings, adjusting prices by feel, guessing which weekends will book, and hoping it all works out.
Here's what that actually looks like without an analyzer:
Running a short-term rental is already a juggling act. Without the right data working in the background, it's easy to feel a step behind, no matter how hard you're working.
If you've wished for a tool that just "gets" your Airbnb business without a full operations team behind it, PriceLabs is built for exactly that. It combines an analyzer, a strategist, and a day-to-day assistant in one place, especially useful if you're managing a few listings and want to get pricing right without living in spreadsheets.
Here's how PriceLabs turns data into decisions.
Portfolio Analytics is your rental business dashboard. It pulls together your average daily rate, occupancy rate, and future pacing into one visual read, so you can catch a slipping listing or a strategy that needs adjusting without being a numbers person.
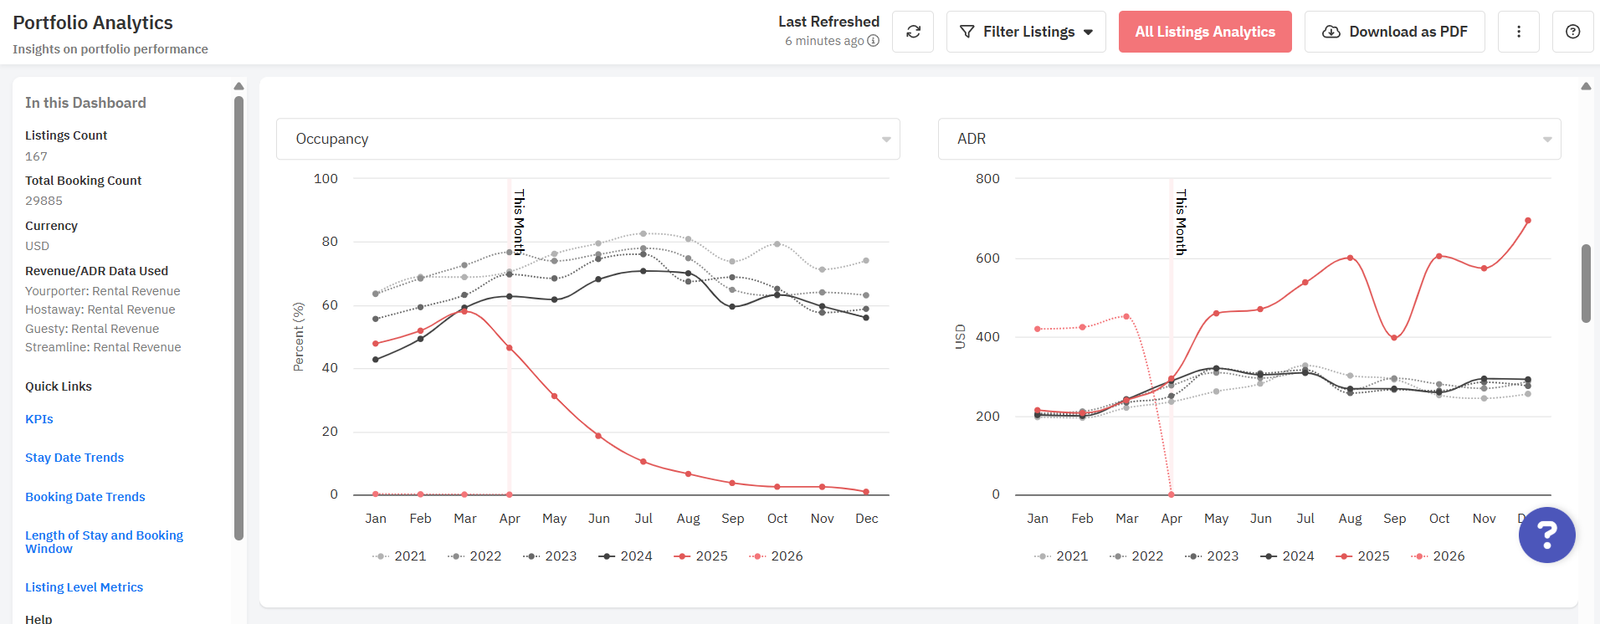
It answers questions hosts ask constantly: Why was last month slower? Am I charging too little on weekends? Is this listing beating the others? Filter by listing, market, or bedroom count, compare year over year, and run diagnostics without switching tools. You can also build custom, exportable views through Report Builder if you need something specific to share with an Airbnb co-host or an accountant come tax season.
No two markets behave the same, and two neighborhoods in the same city can move in opposite directions. Hyper Local Pulse is PriceLabs' dynamic pricing engine, built on neighborhood-level demand modeling and updated daily, rather than relying on citywide averages.
It works through three underlying pieces:
Take a two-bedroom listing in Austin the week a major festival lands nearby. A citywide average would miss that completely and price the listing the same as any other week. Hyper Local Pulse picks up the change in local booking velocity and adjusts the recommended rate for that specific street, not the metro area as a whole.
This is where PriceLabs differs from a lot of analyzer tools: the pricing recommendation isn't a separate product bolted onto the data. It lives in the same Portfolio Analytics view, on a flat monthly fee with no revenue-share cut.
Getting started is refreshingly simple. No deep setup guides, no overwhelming dashboards. If you can connect your listing to Airbnb, you can start analyzing with PriceLabs.
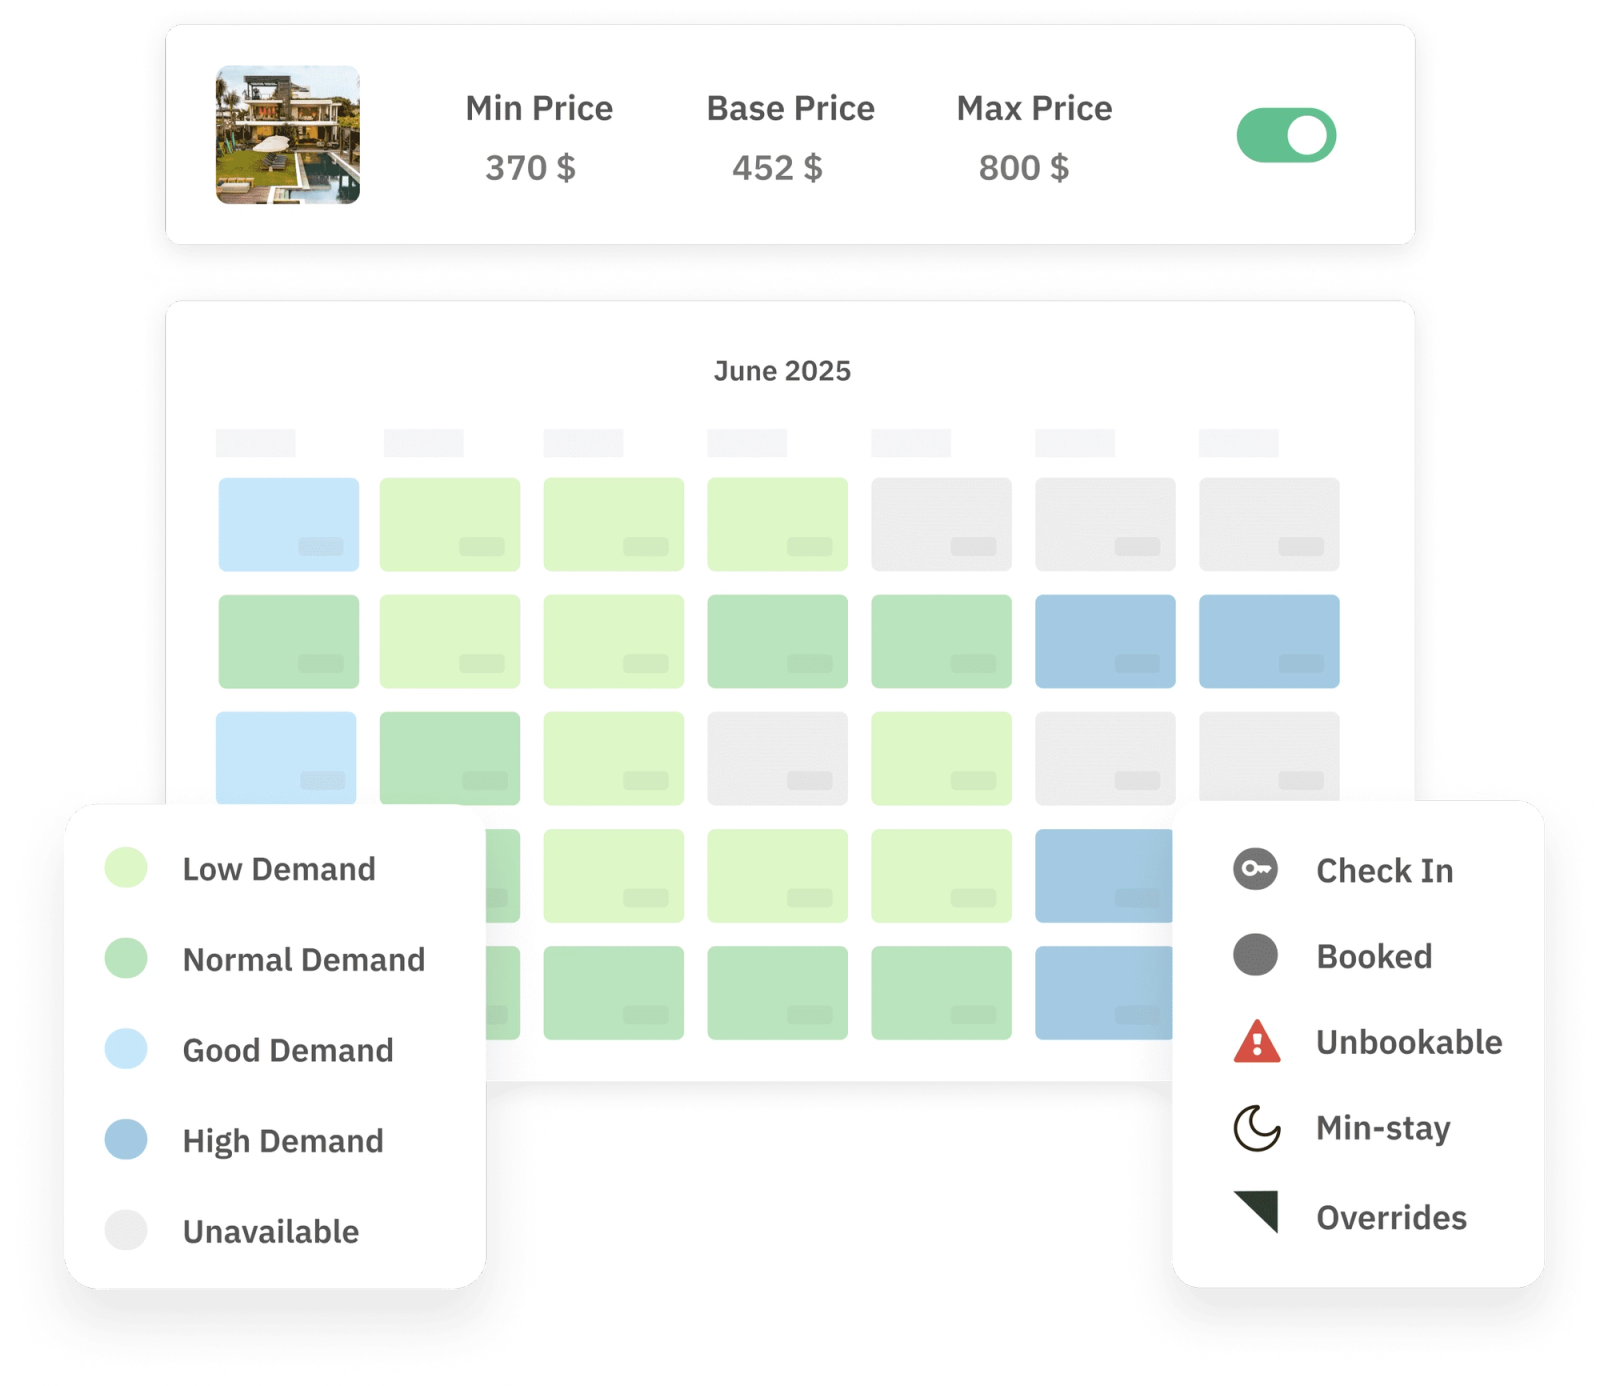
There's a free 30-day trial, so you can see how the recommendations look on your own listing before committing to anything.
For hosts managing a handful of listings, staying competitive without burning out is a balancing act. You don't have time to track market trends every week or adjust prices daily, and you shouldn't have to.
An Airbnb analyzer, especially one that pairs analytics with automated dynamic pricing, turns that balancing act into a system: the data tells you what's happening in your market, and the pricing engine acts on it before you have to.
Ready to see it on your own listing? Start a free trial and get your first analysis today.
For a small host, look for a tool that combines analytics and pricing automation instead of paying for two separate subscriptions. PriceLabs works for a single listing, charges a flat monthly fee with no per-listing or revenue-share pricing, and includes competitor benchmarking, pacing, and dynamic pricing in the same dashboard.
AirDNA and PriceLabs both offer limited free access. AirDNA's free tier gives a surface-level market snapshot, useful for a quick sanity check before investing in a property. PriceLabs offers a free 30-day trial with full analytics and pricing access, which is more useful once you already have a live listing to analyze.
Start with three numbers: your average daily rate, your occupancy rate, and your booking pace relative to the same period last year. An Airbnb analyzer pulls all three into one dashboard and adds competitor benchmarking, so you can see whether a slow month is a market-wide trend or specific to your listing.
At minimum, track average daily rate, occupancy rate, booking window, and revenue per available night. Together, these show you not just how much you're earning, but how far in advance guests are booking and whether your pricing is leaving money on the table during high-demand dates.
An analyzer shows you data: your performance, your competitors' rates, and market trends. A dynamic pricing tool goes a step further and adjusts your nightly rate automatically based on that data. PriceLabs does both in a single product, so you're not stitching together two separate tools.
Tools built for property managers scale, but the underlying data, competitor rates, local demand, and your own booking history, matters just as much for one listing as it does for fifty. Since pricing models vary from flat fee to per-listing to percentage-of-revenue, check the cost structure against how many properties you actually have before subscribing.
Whichever analyzer you choose, the underlying goal is the same — see our guide to building a real comp set for benchmarking.
Want to learn what PriceLabs can do for you? See for yourself with a free trial. Get started now!