
Get started with PriceLabs now!
Want to learn what PriceLabs can do for you? See for yourself with a free trial. Get started now!

What does it actually take to win a booking in Australia's Airbnb market right now? Active listings grew 5.6% in a single year, occupancy climbed in every peak month, and guests are booking later than ever — three shifts that reward hosts who adjust rates in real time and punish anyone still pricing by gut feel. This report breaks down Australia's 2024-25 short-term rental performance month by month and region by region, and shows where sharper demand tracking and real-time rate adjustments turn these trends into extra revenue.
In short: Australia's short-term rental market grew across every major metric in 2024-25 — active listings rose 5.6% to 161,296, occupancy climbed 4-5 percentage points in peak months, and ADR hit a period high of USD 182 / AUD 279 in October. Early booking pace for July 2025 is running behind 2024, but rates are still up 2.9% year-over-year — meaning hosts who hold their pricing strategy and adjust closer to check-in stand to win the most revenue.
Key takeaways:
Unless otherwise cited, occupancy, ADR, and RevPAR figures below come from PriceLabs' Market Dashboard analysis of the Australian short-term rental market.
Hometime, Australia's largest collection of professionally managed holiday homes, has published a list of the best Airbnb markets in Australia — a useful starting point, but rankings shift fast in a market growing this quickly.
Stay ahead of the market and find the amenities your guests actually want with PriceLabs Market Dashboards. Use Market Dashboard and Neighborhood Data to track competitor pricing and demand shifts, and set a stronger pricing strategy for your property.
Active listings in Australia grew from 152,626 in 2023-24 to 161,296 in 2024-25 — a 5.6% year-over-year increase. Independent data from Airbtics confirms the trend: it tracked 13.79% average supply growth across the 46 Australian markets it monitors in 2025, with Melbourne (+3,251 listings), Sydney (+2,851), and Brisbane (+1,459) adding the most new supply.
This surge signals strong host confidence. It also means visibility is harder to win. Standing out now takes professional listing quality, strong guest reviews, and dynamic pricing that reacts to competitor supply in real time — not a fixed nightly rate set once a year.
Booked nights grew by double digits across nearly every peak month in 2024. That is a sign traveler confidence — and the booking season itself — is stretching well past the traditional summer peak.
Occupancy rates climbed steadily:
A 4-5 percentage point jump means more nights are getting booked in a more crowded field. That is good news for hosts who price to match demand, and a warning for anyone whose rates haven't moved with the market.
Rising occupancy hasn't come at the cost of rate. Higher ADR and RevPAR together show guests are willing to pay more. But with supply up 5.6%, hosts who don't track the market closely risk leaving bookings — or revenue — on the table.
National averages hide a lot. Where you operate in Australia changes which levers matter most, and new independent city-level data makes the gap between markets even clearer.
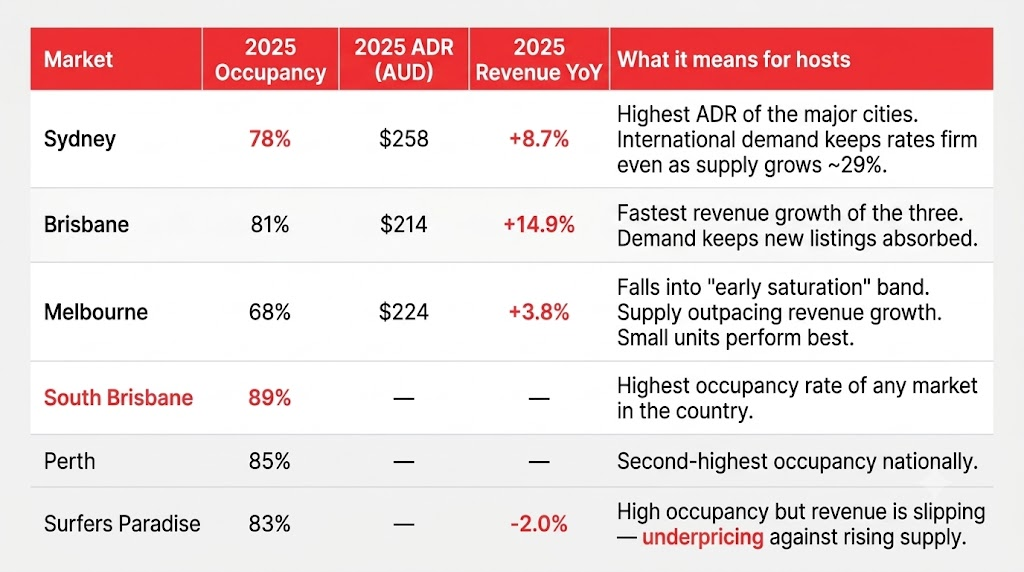
Source: Airbtics, Australia Short-Term Rental Market Review 2025.
Reading the table by region:
Market Dashboard and Neighborhood Data help hosts spot which pattern applies to their listing: custom Comp Sets benchmark rate and occupancy against nearby competitors rather than a national average, pacing charts show whether your market runs ahead of or behind last year, and neighborhood-level demand data flags oversupply risk before it hits your calendar.
The 2024-25 period also showed clear seasonal shifts:
Traditionally off-peak, winter now performs well:
Winter travel is becoming genuinely popular, likely driven by regional getaways, ski destinations, and short domestic trips.
Spring is the strongest season, with October hitting peak ADR — the best window for premium pricing strategies.
PriceLabs Market Dashboard pacing data shows a nuanced picture heading into mid-2025. Demand fundamentals remain strong, but booking behavior is shifting.
Travelers are booking later but paying more, particularly for premium properties or peak dates. This shift toward shorter booking windows is likely driven by:
Rapid growth comes with real hurdles. Understanding them is the first step to protecting profitability.
1. Intense competition. Active Airbnbs rose 5.6% YoY to 161,296 listings, making visibility on Airbnb and Vrbo harder to win. Appearing on the first page of search results now takes a sharp pricing strategy and strong reviews. Underpricing in saturated areas like Sydney or Melbourne CBD erodes profitability; overpricing risks empty nights.
2. Pricing volatility. ADR swung from USD 170/AUD 260 in July to USD 182/AUD 279 in October, events spike demand unexpectedly, and guests book closer to check-in. Fixed seasonal rates risk underpricing surges and overpricing soft periods — both cost real revenue.
3. Shorter booking windows. Many reservations now land within 14-30 days of arrival, down from 60-plus pre-pandemic, and last-minute bookings are common off-peak. Dropping rates too early wastes revenue; holding them too high for too long empties the calendar as check-in nears.
Staying profitable means adapting to changing booking behavior, rising competition, and fluctuating demand.
Lower early pacing numbers often cause concern, but bookings historically surge in the final 30 days before check-in, especially in July and August. Dropping prices too early risks lost revenue — small adjustments closer to arrival dates protect ADR while still securing occupancy. Since travelers pay more for quality stays as check-in nears, flexibility matters:
Hosts should also prepare for demand spikes around school holidays and major sporting fixtures, which can trigger booking surges just 2-4 weeks out. Capturing these manually is tough — automation makes it realistic.
Static pricing hurts your listing's performance. PriceLabs' Dynamic Pricing and Revenue Management tools adjust your strategy to market conditions, seasonality, and competition — helping you earn the reviews that come with consistently competitive rates.
PriceLabs takes the complexity out of revenue optimization with:
What is the average Airbnb occupancy rate in Australia in 2025? July 2025 occupancy pacing sits at 36.8%, behind 2024's 39.9%, per PriceLabs Market Dashboard data. Across Airbtics' 46 tracked markets, full-year 2025 occupancy averages 62.2%, with South Brisbane (89%) and Perth (85%) well above that mark. See our guide on occupancy rate to benchmark your listing.
When is the best time to raise prices on Airbnb in Australia? October is historically strongest, with ADR peaking at USD 182.7 / AUD 279.6 in 2024 — the highest point in the report period. Spring consistently out-earns winter, so timing seasonal pricing changes to that window captures the most upside.
How does dynamic pricing work for Australian short-term rentals? Dynamic pricing adjusts nightly rates automatically based on demand, competitor pricing, seasonality, and events instead of a fixed rate card — moving with booking-pace shifts like the ones heading into July 2025, so last-minute demand gets captured without underselling earlier in the window.
Which Australian cities have the highest Airbnb ADR and occupancy? Sydney posts the highest ADR among major cities at AUD 258, with 78% occupancy. Brisbane leads on occupancy at 81%, while South Brisbane (89%) and Perth (85%) top the national rankings. Use a comp set to see how your neighborhood compares.
How many Airbnb listings are there in Australia? Australia had 161,296 active listings in 2024-25, up 5.6% YoY, per PriceLabs Market Dashboard data. Airbtics puts 2025 national supply growth even higher, at 13.79%. Check demand in your area before listing.
The Australian short-term rental market is growing on every metric that matters — listings, demand, occupancy, and rate. That growth is exactly why static pricing is now a liability: with 5.6% more competition and booking windows shrinking, the hosts who win are the ones adjusting rates weekly, not seasonally. The way forward is straightforward: benchmark your market, automate the adjustments, and let the data catch demand spikes before your calendar does. PriceLabs' Dynamic Pricing and market analytics are built to do exactly that.
Want to learn what PriceLabs can do for you? See for yourself with a free trial. Get started now!